
Cách làm IELTS Writing Task 1 Pie Chart chi tiết

Biểu đồ tròn là một trong những dạng bài phổ biến trong IELTS Writing Task 1. Dạng biểu đồ này thể hiện tỉ lệ phần trăm của các thành phần trong một tổng thể. Việc hiểu cách đọc và miêu tả biểu đồ tròn là kỹ năng quan trọng giúp thí sinh dễ dàng đạt điểm cao trong phần thi này.
Lưu ý: Trong mọi bài viết Task 1, bạn không đưa ý kiến cá nhân mà chỉ miêu tả số liệu một cách khách quan.
Mục lục
1. Cấu trúc bài viết mẫu cho Pie Chart
Một bài viết Task 1 nên gồm 4 đoạn cơ bản:
-
Introduction (Mở bài)
-
Overview (Tổng quan)
-
Body 1 (Chi tiết 1)
-
Body 2 (Chi tiết 2)
Bước 1: Viết Introduction (Mở bài)
Mục tiêu: Paraphrase lại đề bài.
Cách làm: Sử dụng từ đồng nghĩa hoặc biến đổi cấu trúc câu.
Ví dụ đề bài:
The pie charts show the percentage of household spending in five categories in 2000 and 2020.
Introduction mẫu:
The two pie charts compare how household expenditures were distributed across five categories in the years 2000 and 2020.
Bước 2: Viết Overview (Tổng quan)
Mục tiêu: Nêu 2-3 đặc điểm nổi bật nhất.
Cách làm:
-
Không nêu số liệu cụ thể.
-
Tập trung vào sự tăng/giảm rõ rệt, hoặc sự khác biệt lớn nhất giữa các mục.
Overview mẫu:
Overall, spending on food and transport made up the largest proportions in both years, while entertainment and others remained the least significant. Additionally, some notable shifts in spending patterns can be seen over the two decades.
Bước 3: Viết chi tiết Body 1
Mục tiêu: Miêu tả chi tiết các mục nổi bật nhất, hoặc số liệu có thay đổi rõ rệt nhất.
Cách làm Nêu số liệu cụ thể, sử dụng từ nối, so sánh và thì quá khứ đơn.
Body 1 mẫu:
In 2000, the largest share of household expenditure went to food, accounting for 30%, followed by transport at 25%. However, by 2020, transport spending had increased to 35%, becoming the most significant category, while food expenditure dropped slightly to 28%.
Bước 4: Viết chi tiết Body 2
Mục tiêu: Miêu tả các mục còn lại, nhấn mạnh vào thay đổi hoặc ổn định.
Body 2 mẫu:
Spending on rent and entertainment showed minor changes. Rent made up 20% in 2000 and remained relatively stable at 21% in 2020. Entertainment expenditure rose modestly from 10% to 12%, while spending on other categories decreased slightly from 15% to 9%.
2. Từ vựng và cấu trúc miêu tả Pie Chart
Các động từ miêu tả thay đổi
| Tăng | Giảm | Ổn định | Thay đổi nhỏ |
|---|---|---|---|
| increase | decrease | remain stable | fluctuate |
| rise | decline | stay the same | vary slightly |
| grow | drop | level off | experience a slight change |
Các mẫu câu nên dùng
-
“The proportion of… rose to…”
-
“… accounted for the largest/smallest share.”
-
“There was a significant increase in…”
-
“The figures for … remained almost unchanged.”
-
“Compared to …, … showed a noticeable rise/decline.”
3. Các lỗi thường gặp khi viết Pie Chart
-
Đừng: Nêu ý kiến cá nhân:
Hãy: Khách quan, chỉ miêu tả số liệu. -
Đừng: Dùng thì sai (thì hiện tại thay vì quá khứ):
Hãy: Xác định rõ thời gian để dùng thì quá khứ. -
Đừng: Không có overview:
Hãy: Overview là phần bắt buộc và rất quan trọng. -
Đừng: Lặp từ
Hãy: Dùng từ đồng nghĩa như: percentage = proportion = share = figure.
4. Bài mẫu IELTS Writing Task 1 – Pie Chart
Đề bài:
The pie chart below shows the household expenditure in a certain country in 2020.

Sample Answer:
Introduction
The pie chart illustrates how households in a specific country spent their money in five different categories in the year 2020.
Overview
Overall, the largest portion of household expenditure was on food, followed by transport and rent. Meanwhile, entertainment and other expenses made up smaller proportions.
Body Paragraph 1
Looking at the data in more detail, food accounted for the highest percentage of household spending, making up exactly 30%. This was closely followed by transport at 25%, while rent represented 20% of the total expenditure. These three categories alone comprised 75% of the household budget.
Body Paragraph 2
In contrast, spending on entertainment and other miscellaneous items was significantly lower. Entertainment expenses took up 15%, and other expenditures were the least, with only 10%. Notably, there was a 20% difference between the highest and lowest categories.
5. Luyện tập cùng GLN – Trung tâm luyện thi IELTS uy tín hàng đầu
Tại GLN English Center, chúng tôi cung cấp:
- Khóa học IELTS Writing từ cơ bản đến nâng cao
- Sửa bài chi tiết theo band điểm thật
- Giáo viên chấm sát đề thi thật, theo chuẩn IDP – BC
- Lộ trình cá nhân hóa giúp bạn đạt IELTS 6.5+ nhanh chóng
Xem lịch khai giảng mới nhất tại đây.
Tham khảo khóa học IELTS cam kết đầu ra lên tới 8.5 tại đây.
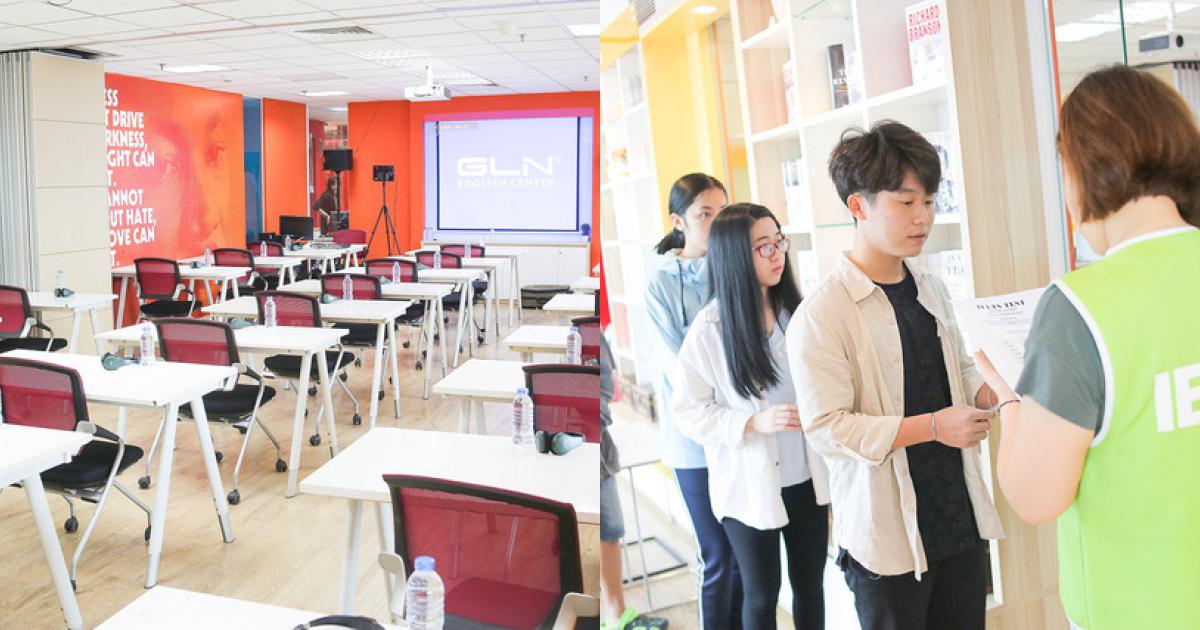
GLN English Center
Để biết thêm thông tin về các khóa học cũng như chương trình ưu đãi, vui lòng đăng ký tại đây hoặc liên hệ hotline tư vấn sau để được giải đáp miễn phí.
- GLN Phạm Hùng: 0989 310 113 – 034 678 1113
- GLN Tràng Thi: 0948 666 358
TIN TỨC LIÊN QUAN

Ngữ pháp IELTS Writing: Cách cải thiện Grammar để tăng band nhanh và bền vững

Các cụm từ ăn điểm trong IELTS Writing


